Over the past week, I’ve been working on a healthcare-related programming project to challenge myself. It’s been a departure from my usual work with data sets, but it has pushed me to think more abstractly. I’m proud of the outcome! Below, you’ll find the video walkthrough and the code for reference.
Here is the reference code
def calculate_avg(patients):
total_age = sum(patient[1] for patient in patients)
total_patients = len(patients)
return total_age / total_patients if total_patients > 0 else 0
def categorize_bp(patient):
systolic, diastolic = patient[3], patient[4]
if systolic >= 130 or 80 <= diastolic >= 89:
return "High Blood Pressure", 1
elif 120 <= systolic < 130 and diastolic < 80:
return "Elevated Blood Pressure", 0.5
elif systolic < 120 and diastolic < 80:
return "Healthy Blood Pressure", 0
return "Uncategorized BP", 0
def categorize_hr(patient):
hr = patient[2]
if hr > 100:
return "High HR", 1
elif hr < 60:
return "Low HR", 0.5
else:
return "Normal HR", 0
def obesity_cat(patient):
return "Is Obese" if patient[6] else "Is Not Obese"
def diabetes_cat(patient):
return "Has Diabetes" if patient[5] else "Does Not Have Diabetes"
def calculate_health_points(patient):
bp_category, bp_points = categorize_bp(patient)
hr_category, hr_points = categorize_hr(patient)
obesity_points = 1 if patient[6] else 0
diabetes_points = 1 if patient[5] else 0
total_points = bp_points + hr_points + obesity_points + diabetes_points
return total_points
def categorize_risk(patient):
total_points = calculate_health_points(patient)
if total_points < 1:
return "Healthy"
elif 1 <= total_points < 1.5:
return "Mild Risk"
elif 1.5 <= total_points < 3:
return "Medium Risk"
else:
return "High Risk"
def risk_visualization(patients):
risk_categories = [categorize_risk(patient) for patient in patients]
return risk_categories
def count_risk(patients, risk_level="High Risk"):
return sum(1 for patient in patients if categorize_risk(patient) == risk_level)
def main(patient_data):
while True:
print('\nMenu')
print('1: Calculate Patients Average Age')
print('2: Print Summary of All Patients')
print('3: Print the Number of Obese Patients')
print('4: Print the Number of Diabetic Patients')
print('5: Print the Number of High Risk Patients')
print('6: Visualize the Distribution of Patient Risk')
print('7: Exit')
choice = int(input("Select an option: "))
if choice == 1:
print(f'The average age of patients in the system is {calculate_avg(patient_data)}')
elif choice == 2:
for patient in patient_data:
bp_category, _ = categorize_bp(patient)
hr_category, _ = categorize_hr(patient)
obesity_category = obesity_cat(patient)
diabetes_category = diabetes_cat(patient)
risk_category = categorize_risk(patient)
print(f"\nPatient: {patient[0]}")
print(f"Age: {patient[1]}")
print(f"Blood Pressure: {bp_category}")
print(f"Heart Rate: {hr_category}")
print(f"Obesity: {obesity_category}")
print(f"Diabetes: {diabetes_category}")
print(f"Overall Risk: {risk_category}")
elif choice == 3:
print(f'There are {sum(1 for patient in patient_data if patient[6])} obese patients')
elif choice == 4:
print(f'There are {sum(1 for patient in patient_data if patient[5])} diabetic patients')
elif choice == 5:
print(f'There are {count_risk(patient_data)} high risk patients')
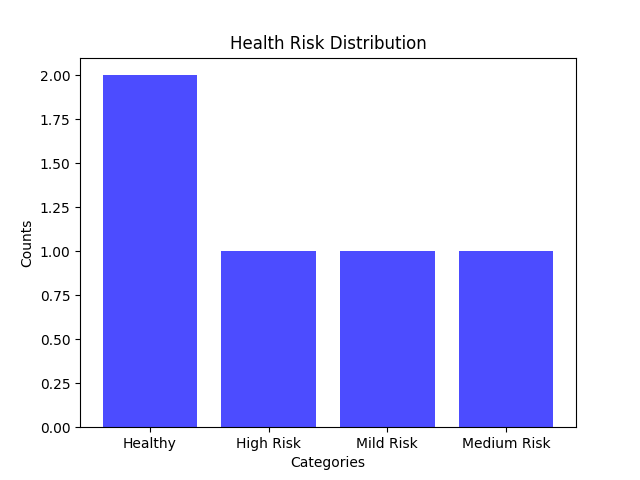
elif choice == 6:
import matplotlib.pyplot as plt
from collections import Counter
counts = Counter(risk_visualization(patient_data))
health_categories = list(counts.keys())
values = list(counts.values())
plt.bar(health_categories, values, color='blue', alpha=0.7)
plt.xlabel('Categories')
plt.ylabel('Counts')
plt.title('Health Risk Distribution')
plt.show()
elif choice == 7:
print('Thank you!')
break
else:
print("Invalid option please try again")
if __name__ == "__main__":
patient_data = []
num_patients = int(input('How many patients do you have today? '))
for i in range(num_patients):
print(f"Patient Number: {1 + i}")
patient_name = input("Patient Name: ")
patient_age = int(input('Patient Age: '))
patient_hr = int(input("Heart Rate (bpm): "))
patient_systolic = int(input("Systolic BP (mmhg): "))
patient_diastolic = int(input("Diastolic BP (mmhg): "))
patient_diabetes = bool(int(input("Diabetes Status (0= No, 1= Yes): ")))
patient_obese = bool(int(input('Obesity Status (0= No, 1= Yes): ')))
patient_data.append([patient_name, patient_age, patient_hr, patient_systolic, patient_diastolic, patient_diabetes, patient_obese])
main(patient_data)
