During my summer internship at the NIH, I was introduced to Principal Component Analysis (PCA) through a colleague. Intrigued by PCA’s potential, I wanted to apply this technique to social data, particularly from the National Longitudinal Study of Adolescent to Adult Health (Add Health), which contains a rich dataset of 10,237 variables.
Objective
My goal was to identify underlying patterns in social factors like academic performance, self-esteem, relationships with parents, and substance use. I narrowed down the vast dataset to 50 key variables to uncover trends and relationships.
Approach
I began by learning PCA through various resources, including Kaggle tutorials and DataCamp courses. I also revisited linear algebra fundamentals to ensure a solid mathematical understanding.
For the analysis:
- Data Cleaning: Initially, I filled missing values with -1, but realized this approach needed refinement based on the scale of responses.
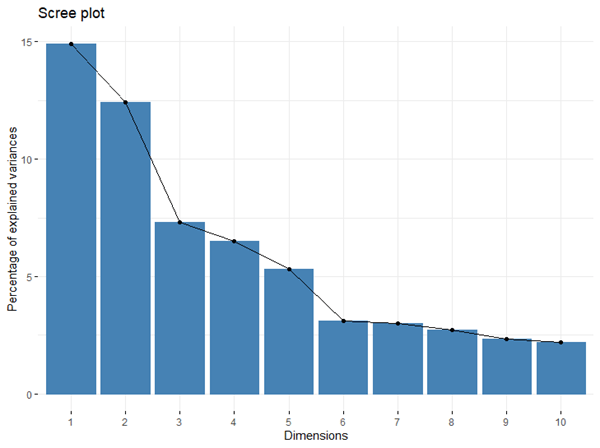
- PCA Implementation: I used the prcomp function in R to perform PCA. Focusing on the first two principal components, which explained 27.3% of the variance, allowed me to manage the complexity.
- Visualization: I created a biplot to visualize the results. Due to the large number of variables, I filtered for the most influential ones, revealing that alcohol usage significantly impacts dataset variability.


Findings
- Principal Component 1: Associated with lower self-esteem, moderate alcohol use, and less satisfaction in parent relationships.
- Principal Component 2: Linked to positive school behavior, higher grades, less loneliness, and lower alcohol consumption.
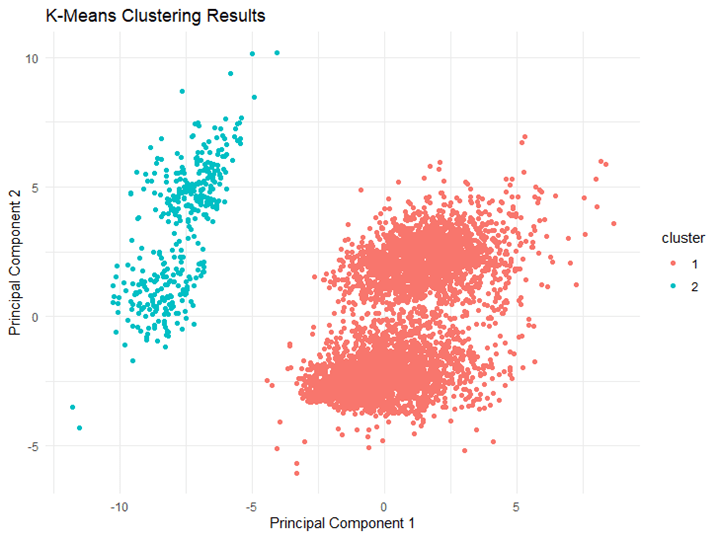
Using K-means clustering, I identified two groups:
- Cluster 1 (Red): Higher on PC1, indicating lower self-esteem and weaker parental bonds.
- Cluster 2 (Blue): Higher on PC2, suggesting better academic performance and less loneliness.
The analysis highlighted how alcohol usage and social factors contribute to overall data variability. I plan to refine my approach with a smaller dataset for better interpretation.
Resources Used
- (datasource)
- (Kaggle tutorial: link)
- (DataCamp tutorial: link, YouTube videos: link 1, link 2)
- Minitab resource: link)
- https://stackoverflow.com/questions/59865922/visualizing-pca-with-large-number-of-variables-in-r-using-ggbiplot)
- scikit-learn.org
- https://bioturing.medium.com/how-to-read-pca-biplots-and-scree-plots-186246aae063
- https://blog.bioturing.com/2018/06/14/principal-component-analysis-explained-simply/
